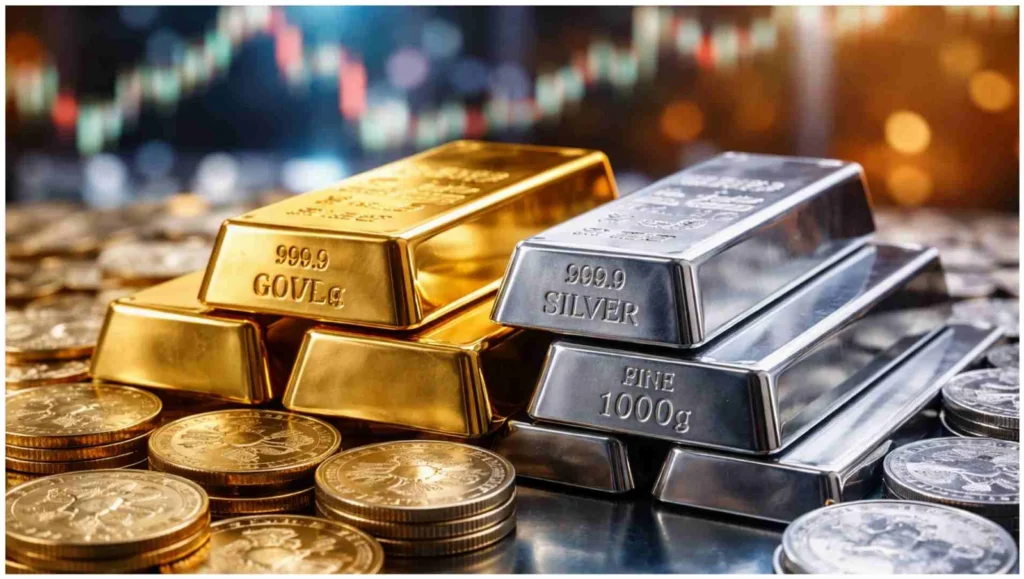

U.S. gold and silver prices moved higher on Friday, September 4, 2026, with gold reaching $4,468.29 per ounce and silver climbing to $66.93 as both precious metals recorded strong daily gains.
At 8:05 a.m. ET, gold was up 1.76%, or $77.41, from its previous close of $4,390.88. Silver gained 2.46%, or $1.61, from $65.33, making silver the stronger performer in percentage terms.
Gold price today: What the numbers show
Gold remains below the $4,601.04 level recorded one week ago, leaving it down 2.89% over seven days. But it is still substantially higher than both its one-month and one-year levels.
Gold traded at $4,072.96 one month ago and $3,556.48 one year ago. That puts its one-month gain at 9.71% and its 12-month advance at 25.64%.
The metal’s 52-week low is $3,551.93 and its high is $5,477.79. Today’s price is therefore about 18.43% below its high and 25.80% above its low.
Silver jumps faster than gold
Silver’s $66.93 price remains below the $69.38 recorded one week ago, a decline of 3.53%. But silver was only $59.45 a month ago and $41.08 one year ago.
Silver is up 12.59% over one month and 62.92% over one year, significantly outperforming gold over both periods.
Its 52-week range is unusually wide: $40.73 at the low and $117.39 at the high. Even after its large annual gain, silver remains roughly 42.98% below that peak.
Gold vs. silver: Today’s key numbers
Silver has delivered more than twice gold’s percentage gain over the past year, but the wider distance from its 52-week high also illustrates its greater volatility.
The recent moves follow an earlier rise in gold and silver as investors reacted to bond yields and the U.S. dollar.
Why are precious-metal prices moving?
Gold and silver prices can respond to Federal Reserve policy, Treasury yields, inflation expectations, movements in the U.S. dollar, geopolitical uncertainty and investor demand.
Interest rates are particularly important because precious metals do not pay interest. Falling yields or expectations for easier monetary conditions can make bullion comparatively more attractive, while rising yields can create pressure.
Official U.S. monetary-policy announcements and economic assessments are available directly from the Federal Reserve.
Geopolitical developments can also change demand quickly. Earlier in 2026, gold prices reacted as markets weighed geopolitical tensions alongside the U.S. rate outlook.
Nikkei Falls Over 4% as Japanese Stocks Hit by Sharp Market Selloff
Nasdaq Futures Gain 246 Points as AI Stocks and Intel Earnings Drive Markets
What XAU/USD and XAG/USD tell investors
XAU/USD shows the dollar price of one troy ounce of gold, while XAG/USD represents silver. One troy ounce weighs approximately 31.1 grams.
Spot prices are market benchmarks rather than guaranteed retail prices. Physical bars and coins typically carry premiums covering fabrication, distribution and dealer costs.
Gold’s $4,500 level is back in focus
Gold is now only about $32 below the closely watched $4,500 level. Silver, meanwhile, would need to gain roughly $2.45 to return to its price from one week ago.
The next move could depend on U.S. economic data, inflation, Treasury yields, dollar movements and Federal Reserve expectations. The large 52-week ranges in both metals are a reminder that strong recent gains do not eliminate the possibility of sharp pullbacks.
Prices can change throughout the trading day and can vary between data providers. This article is for informational purposes only and does not constitute investment, financial or trading advice.

Make Swikblog your go-to source on Google for reliable updates, smart insights, and daily trends.