Price action snapshot
52-week range
C$14.48 – C$30.15
Day’s range
C$28.96 – C$29.91
Cenovus has moved into a “momentum + fundamentals” zone: the stock is up 27% over the past month while printing a fresh 52-week high at C$30.15. The next big test is whether Feb. 19 results and management commentary can extend that run.
Why CVE is moving now: the rally is being driven by a clean sequence of catalysts: a strong month of price action, a near-term earnings date, and a newly closed transformational acquisition. Cenovus completed the purchase of oil sands peer MEG Energy in an $8.6 billion deal (debt included), and the market is now pricing in what that scale can do to cash flow and operating leverage over 2026 and beyond.
Management has pointed to more than $400 million in synergy benefits targeted by 2028. If those savings translate into the income statement on schedule, the math can be meaningful: lower unit costs can widen margins even if commodity pricing stays merely “supportive” rather than spectacular. That’s why the Feb. 19 call matters—investors are listening for early, specific integration milestones and the cadence of cost capture.
| Metric | Latest shown | Why it matters |
|---|---|---|
| Close / daily move | C$29.90 (+C$0.87 / +3.00%) | Momentum is strong heading into earnings; breakout traders watch follow-through. |
| 52-week high | C$30.15 (range: C$14.48–C$30.15) | Signals fresh demand; also raises the bar for guidance and synergy proof points. |
| Valuation | P/E (TTM) 17.28; EPS (TTM 1.73) | Frames whether the run is “priced for perfection” or still supports upside. |
| Income profile | Forward dividend C$0.80 (2.68%) | Helps total return appeal while investors wait for integration benefits to land. |
| Risk / sensitivity | Beta (5Y monthly) 0.61 | Historically less volatile than many cyclicals, though oil-linked swings still apply. |
What the market wants to hear on Feb. 19: the short version is “show the receipts.” The MEG deal reportedly closed at a 47% premium, and investors know that headline synergies can be easy to advertise and harder to deliver. The most credible updates tend to be operational: procurement wins, staffing overlaps, maintenance optimization, and measurable unit-cost improvements with dates attached.
There’s also a timing reality. The transaction closed in November 2025, so the upcoming report may include only about six weeks of MEG contribution. That means the market could get early directional signals—production mix, integration progress, cost discipline—without seeing the full run-rate impact yet. Patience is often required before the synergies become visible quarter after quarter.
Quick “what could move the stock next” dashboard
Analysts’ average EPS estimate for Q4 2025 and Q1 2026 has been cited as trending higher, up 26% in the past 60 days to $0.28 per share. If guidance confirms that trajectory while integration stays on schedule, the market often rewards the clarity.
The bigger question: can the MEG acquisition create a “larger, stronger” Cenovus without letting costs creep? MEG assets have been pegged as capable of lifting annual productivity by roughly 15% to 20% in 2026. If that productivity shows up alongside disciplined spending, the story shifts from speculative synergy talk to a more concrete cash-generation narrative—exactly the kind of tone that can keep a breakout alive even after a sharp month-long run.
Investors looking for the official webcast and reporting details can find them through Cenovus’s investor relations page. In the days around earnings, CVE often trades more on execution language than on any single headline number, because the market is trying to separate “short-term pop” from a multi-quarter integration win.
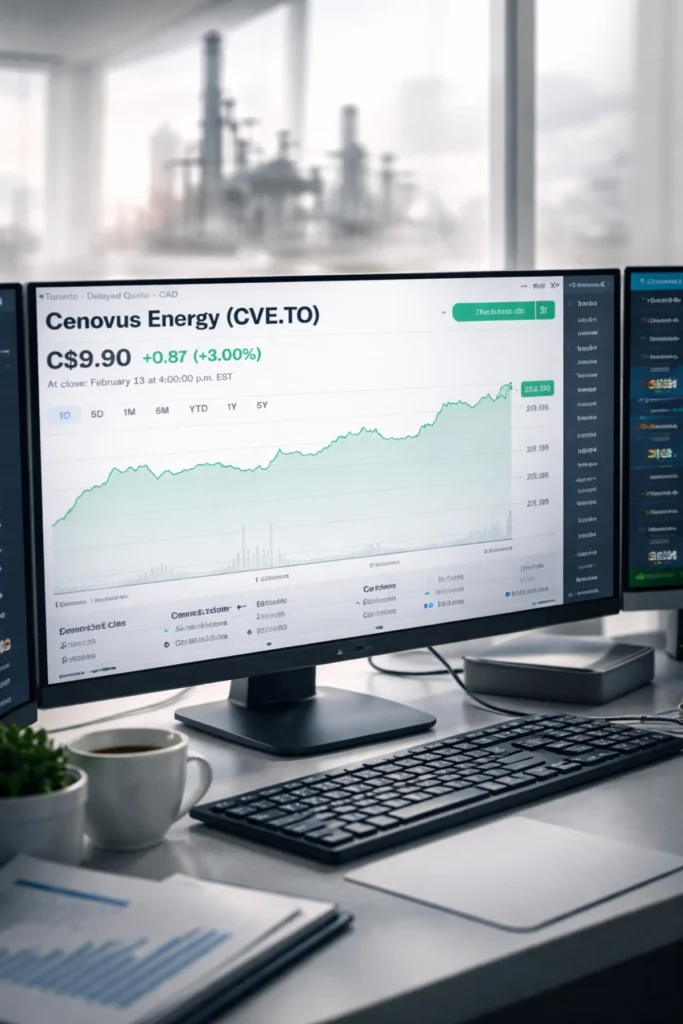
Alt text: Cenovus Energy trading screen with TSX CVE price chart trending upward on a clean, modern finance dashboard, neutral light background, no text overlay.
Make Swikblog your go-to source on Google for reliable updates, smart insights, and daily trends.