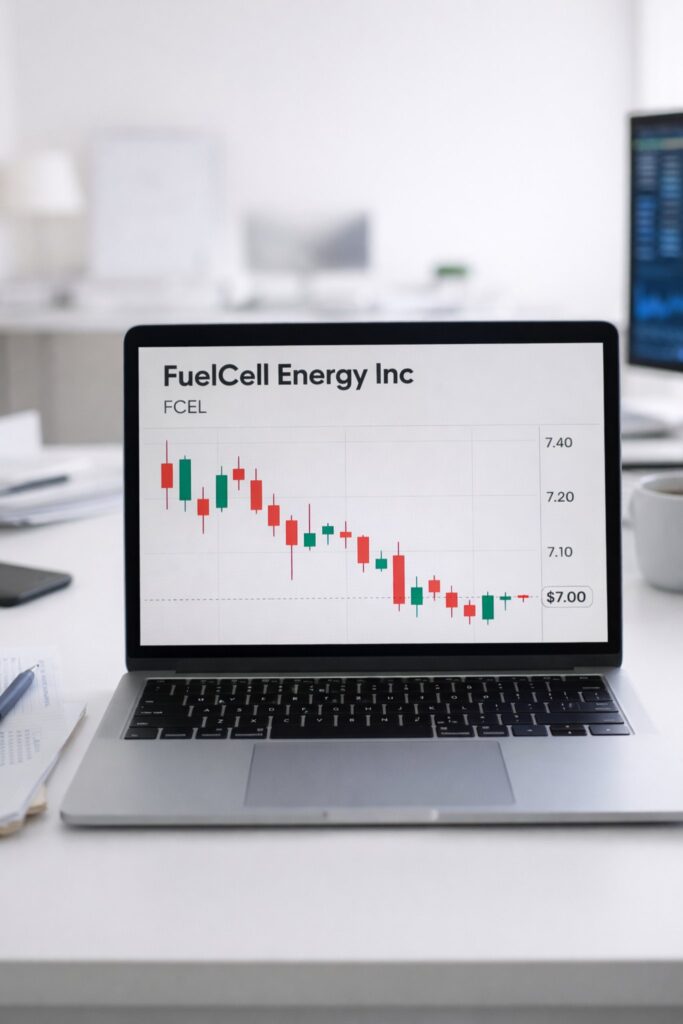
U.S. clean-energy stocks have turned jumpy again, and FCEL is right in the crosshairs.
FCEL price action at a glance
| Metric | Today |
|---|---|
| Last trade (approx.) | $7.05 -4.6% |
| Previous close | ~$7.39 |
| Day range |
Low ~$6.92 to High ~$7.55
Range bar shows FCEL sitting in the lower half of today’s band.
|
| Volume (intraday) | ~1.08M shares |
The story traders are watching is simple: FCEL is pressing into the $7 area, a level that often acts like a magnet when momentum turns cautious.
FuelCell Energy’s stock drop today looks less like a single-company shock and more like a familiar pattern for this corner of the market: an early attempt to hold the open, followed by sellers leaning on the price until it revisits a widely watched number. In FCEL’s case, that number is $7.
The intraday move matters because FCEL is a name that can turn technical quickly. Once momentum traders sense that bids are thinning out, price action often compresses into a narrow range — and then breaks. That’s why the $6.90–$7.00 area is the near-term battleground: it is close enough to attract dip buyers, but also close enough to trigger stops if the market mood worsens.
Why the $7 level is doing so much work
Round numbers become “sticky” in heavily traded small- and mid-cap stocks, especially when headlines are light and the market is driven by positioning. If FCEL stabilizes above $7 into the close, that often signals that sellers have exhausted themselves — at least temporarily. If it fails decisively, traders typically start scanning for the next shelf of demand below.
- Support zone: around $6.90–$7.00, where today’s low printed and where buyers tend to probe.
- First resistance: around $7.25–$7.35, where failed bounces often stall when sentiment is cautious.
- Upper ceiling: the $7.50+ area, close to today’s intraday high, which would need stronger risk-on buying to reclaim.
From a fundamentals perspective, the fuel-cell and hydrogen theme still lives and dies on a mix of policy tailwinds, project wins, and execution — but on days like this, the market often trades the category as a single basket. When the broader market turns choppy and yields stay firm, the basket gets marked down first and analyzed later.
What investors are watching next
For investors, FCEL’s biggest question isn’t whether it can bounce a few cents. It’s whether the stock can find a base that lasts long enough for the company’s longer-term catalysts to matter. In practice, that means watching liquidity, dilution risk, and whether the business can translate backlog and partnerships into repeatable revenue — the kind that can survive a market that’s no longer forgiving.
For traders, the checklist is more immediate: does volume expand as FCEL tests $7, and do buyers defend that line with conviction? A flat tape can still produce sharp single-name moves, but a weak tape can turn a “normal dip” into a cascading break. This is why the market context matters as much as the company context right now.
Mini “graph” you can reuse in the article
This simple range chart works well on mobile and keeps readers anchored to the key levels:
| Level | Price | Visual |
|---|---|---|
| Intraday high | ~$7.55 |
|
| Current area | ~$7.05 |
|
| Intraday low | ~$6.92 |
|
Readers don’t need complex indicators to understand the moment: FCEL is hovering near the lower edge of the day’s range, with $7 acting as the headline level.
If FCEL can hold $7 and reclaim the mid-$7s, the stock may calm down quickly — especially if the broader market steadies. If it can’t, the risk is that sellers keep pushing until a new buyer cluster shows up. Either way, this is the type of session that often sets the tone for the next few trading days.
For readers tracking the wider market, you can also see how risk appetite is behaving across sectors in your related coverage: Canada Stock Market Live: TSX Slides Over 700 Points and Shopify Stock Tumbles 6% as Wall Street Flags Margin Pressure.
For the official listing and quote page readers often check first, here is FCEL on Nasdaq.
Make Swikblog your go-to source on Google for reliable updates, smart insights, and daily trends.